I didn’t count any of this by hand. I wrote one prompt, pointed Claude Code at the workspace, and it ran a subagent per slice, reconciled the answers into one report, then built the animated card above from that report. Here is the prompt. It knows nothing about OffMain, so paste it into your own repo and see what comes back.
# By the numbers, then the GIF
Two deliverables, in order. A: `BY-THE-NUMBERS.md`, this project's real numbers with the method behind each. B: a square GIF and MP4 for X, built from A, in the project's own brand.
Work through the steps in order. Finish each step before the next.
## Part A: the report
### 1. Recon (scope only)
From this session, with plain shell commands, map the workspace:
- the repos or packages, and the default branch of each
- the first and last commit dates across all of them (`git log --all --reverse --format=%ad --date=short | head -1`, then the same without `--reverse`)
- where these live, when they exist: issue tracker or board, decision records (ADRs, RFCs, design docs), changelog, planning docs, research docs, docs folder, CI config
Recon answers "what exists and where". It produces no figures. Recon is done when you can write the slice list in step 2 with an exact path or command for each slice, and "does not exist" for each slice the project lacks.
### 2. Fan out
Launch read-only subagents in one parallel batch, one per slice. Each figure belongs to exactly one slice. A smaller model is fine; the work is counting. Without subagents, run the slices one after another, each in a fresh context.
Slices (drop the ones recon marked "does not exist"; add the ones this project has that the list lacks):
- Commits. Total, per repo, per active day, active days out of calendar days, longest run of consecutive days, longest gap, busiest day. Count all branches and the default branches separately and report both. Human and bot authors, distinct author emails.
- Pull requests. Opened, merged, closed unmerged, still open. Lines added and deleted, files changed, per month and per week. Median time from open to merge. The five largest. Use the host CLI (`gh pr list --state all --limit 1000 --json ...`), save the JSON to a file, and cross-check the merged count against `git log --merges`. When the two disagree, report both numbers and the likely reason.
- Decision records. Records, status split, date span, words, decisions inside them (count the items in each record's Decision section and state the rule used when a record has none), the record with the most decisions and what it supersedes.
- Tickets. Total, by state, by priority, by label, closed per week, words of ticket text.
- Planning artifacts. Roadmaps, maps, specs: items total, resolved, deferred, open.
- Changelog. Entries, by component, by category, date span.
- Codebase. Production lines and test lines per repo, test files, test cases (count test functions or test attributes per language and name the pattern), language split, tracked files. Git-tracked files only.
- Surface area, one subagent per platform or service. Endpoints, tables and migrations, screens or views, build targets, modules, entry points, CI workflows.
- Docs corpus. Words and files by kind: docs, research, glossary terms, posts, postmortems, handoff notes.
- Process. Branches by type prefix, worktrees, tags, project-specific agent skills and tooling.
- Work rhythm. Commits by weekday and by hour, weekday and weekend share, the quiet hours.
Every subagent prompt carries the same five rules:
1. Read only these paths: [the exact paths from recon].
2. Return numbers, as a table or a list of figures. Use prose only to explain a number.
3. Add a method line to every figure: what was counted, and the command or rule, so a human can re-run it.
4. Exclude vendored and generated files (dependency folders, build output, lockfiles, generated migrations and API files, worktree copies) and name what was excluded.
5. "Does not exist" is a valid answer. Write it when it is true.
A slice is done when every figure has its method line and its exclusions are named.
### 3. Follow up
When a time series or a breakdown is missing, send a follow-up to the subagent that already holds the data. It answers from its saved JSON or its earlier counts.
### 4. Reconcile and write
Read only the final summaries. Where two slices disagree (all branches against default branches, host API against merge commits, author date against commit date), keep both figures in the report with the reason.
Write `BY-THE-NUMBERS.md` at the workspace root:
- "As of" date and the date range from recon
- How long: calendar days, active days and their share, longest run
- Headline counts, one table
- One section per slice: figures first, method notes under them
- Work rhythm, one paragraph
- Worth knowing: what a slice found that the totals hide, such as a component with no merged work for weeks, or a doc that has drifted from the code
The report is done when every figure traces to a slice summary, every disagreement between sources shows both figures, and every section has its method notes.
## Part B: the GIF
### 5. Interview, one round
Ask these in one round, each with your recommended answer, then wait for the answers:
- Which stats. Propose four to six cards from the report. Lead with the one that reframes the rest, where scope beats volume ("one person, five platforms, nine weeks"). Prefer rates, grids and ratios over raw totals (58 of 63 days over 1,175 commits). Name the vanity totals you leave out (lines added, branches, worktrees) and why.
- Palette. The site's light or dark theme, by its name in the tokens.
- Where it posts, and the shape. X: 1:1 at 1080x1080, GIF under 15 MB, MP4 alongside. LinkedIn flattens GIFs, so video there.
- The closer. Wordmark, tagline, call to action, or a subset.
Done when every card, the palette, the shape and the closer are the user's choice.
### 6. Facts from the environment
Read the site or design repo for: the color tokens of the chosen theme, the font files, the logo mark and wordmark components, the icon sets already in use, the headline type treatment (size, weight, case, tracking), the voice rules, and the glossary's avoid list. Pull the data behind each visual from its source, such as `git log --all` per day for a day grid or decisions per record for a bar chart, and check each against the report.
Done when every figure and every visual's data traces to a file or a command, and every word of copy is one the glossary allows.
### 7. Design
One idea per card. Each card: one big figure, one label, one visualization, in a form different from its neighbours (tiles, calendar grid, bar chart, ratio bars). A persistent header with the small wordmark and the date range. Headlines in the site's own treatment. GitHub figures use Octicons; platforms use the brand glyphs the site uses. Copy follows the voice file.
Done when the card list names, for each card, its figure, its label, its visual form and its data source.
### 8. Build
One self-contained HTML page at 1080x1080: tokens copied from the site's stylesheet, font files copied beside it, icon path data generated from the site's source files by script, per-visual data generated into `data.js` by script. The animation is a pure function `render(t)`: every frame is a function of time, `window.__seek(t)` and `window.__total` are exposed, and a `?capture` query turns off the live loop.
Motion: transform and opacity only. Enters ease-out with a 100 to 150 ms stagger. Exits faster and quieter, a short fade with a 12 px rise, ease-in. Count-ups ease-out with tabular numerals. Bars scale from their origin. About four seconds per card, with a full second of hold after it settles. The closer fades to the background so the loop seam is continuous.
Done when `?t=<seconds>` opens the page on any frame and every number on screen matches the report.
### 9. Capture and encode
Drive the installed Chrome with puppeteer-core (or Playwright when present): viewport 1080x1080 at device scale 1, wait for `document.fonts.ready`, then seek and screenshot every frame at 20 fps. Encode with ffmpeg: `palettegen` then `paletteuse` with bayer dither for the GIF, libx264 yuv420p for the MP4. Rotate the loop start so frame 0 is a settled card; X shows frame 0 as the poster.
Done when both files exist and the GIF is under 15 MB.
### 10. Review, then iterate
Look at the output as images before you show it:
- stills at each card's settled moment, for layout and typography
- a contact sheet of every eighth frame, for pacing
- frames extracted from the GIF itself, for dither and palette
- frame 0 against the last frame, for the seam
Fix what is wrong, re-render, and look again. Done when every card is right at full size, the pacing holds, the GIF frames are clean, the seam matches, and every number in the GIF matches the report.
Deliver the GIF and the MP4 with their sizes, the list of cards, the data source behind each visual, which file to upload where, and any concession you made.The rest of this post is what it found on mine, and what I make of it.
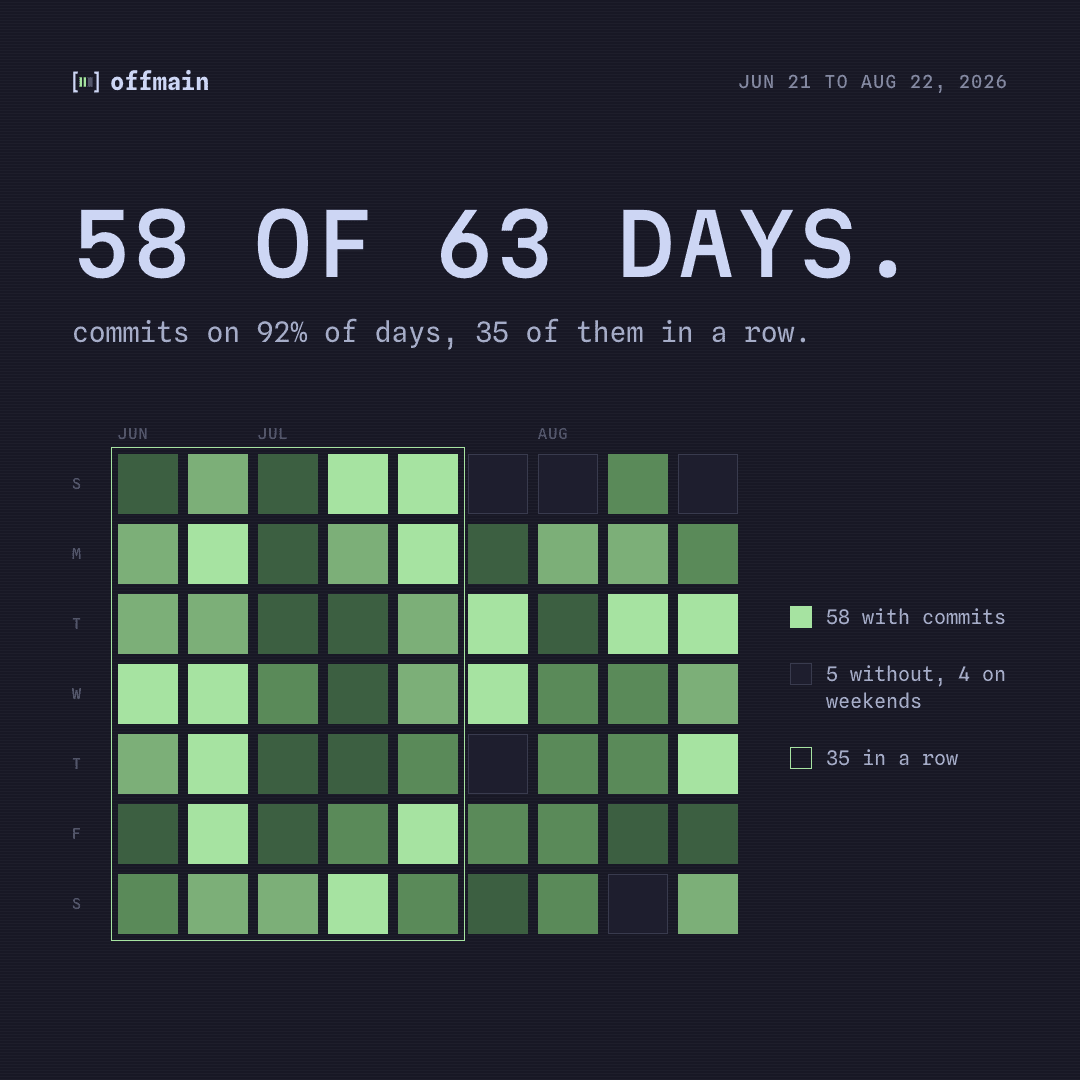
The number I care about is 58 of 63
I have started a lot of side projects. The pattern was always the same: two good weekends, then a repo I felt bad about every time I opened GitHub. OffMain is the first one that made it past week three. It is now at week nine.
Fifty-eight of 63 days had a commit. Four of the five empty days were weekend days. The longest gap was two days. The longest run was 35 days in a row, which covers the entire first five weeks, including the week I tore the product down and rebuilt it around minutes instead of daily goals.
I want to be careful about what that grid means. It doesn’t mean I sat down and typed for 63 days. I have a day job and two little kids, so this happened in whatever gaps the day had. The commit log has gaps at every hour from 6am to midnight. A lot of the commits were written by agents I was directing, in parallel, across 16 git worktrees on the Apple repo alone. What the grid measures is whether I showed up to decide things. I did, 58 times.
I wrote down 199 decisions
This is the figure I’m proudest of, more than the commit count. A commit is cheap when an agent writes it. A decision still costs me.
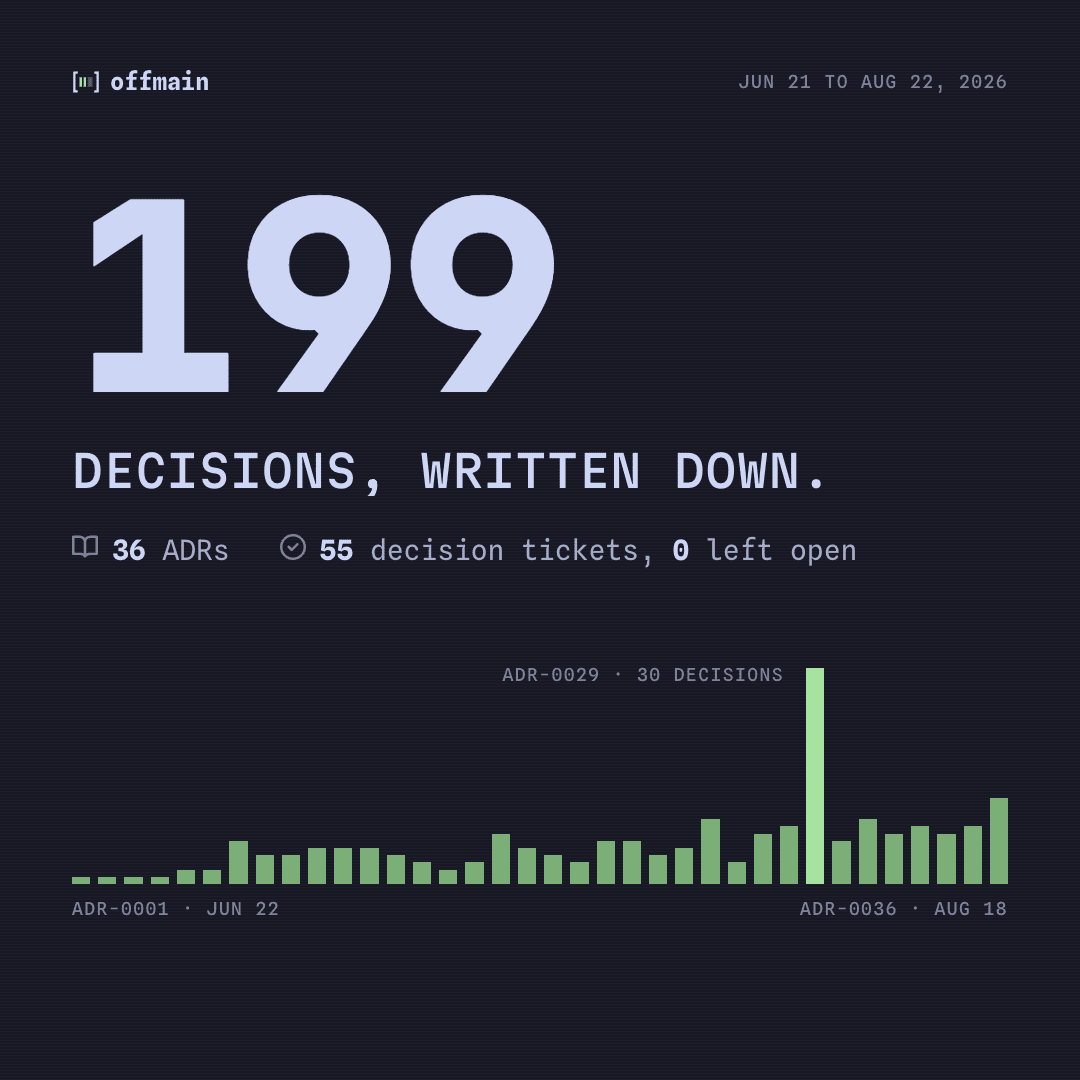
OffMain has 36 architecture decision records, and the Decision sections inside them hold 199 separate calls. On top of that, three planning maps produced 55 decision tickets, and all 55 are closed or deliberately deferred. Zero are still open.
ADR-0029 is the hinge. It holds 30 decisions on its own, supersedes five earlier ADRs outright, and amends seven more. That is the pivot from daily goals and streaks to a minutes ledger, where your GitHub activity pays for your breaks. Most of what the site says today traces back to that one document.
Honestly, the reason I kept going is in that number. When I work with agents, the code stops being the hard part. The hard part is knowing what I want, and being able to point at the reason a week later when something feels wrong. Writing the decision down is how I keep the agents from quietly relitigating it. Me too (btw).
The backend has more test code than production code
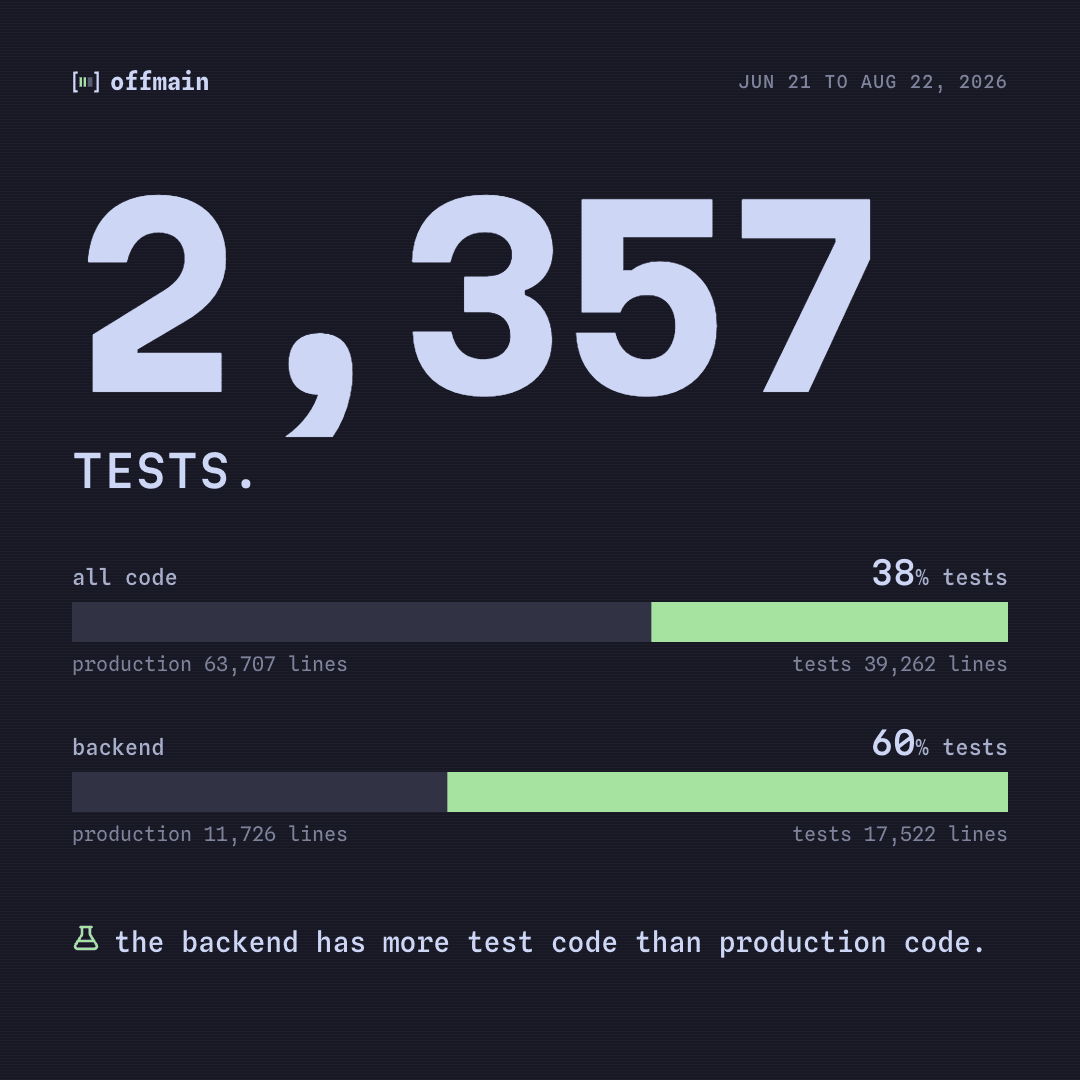
2,357 tests: 1,377 Swift test cases, 980 Python test functions, plus the Kotlin and TypeScript suites. The backend is 11,726 lines of production code and 17,522 lines of tests, so 60% of that repo is tests.
That ratio is on purpose. The backend is the only place a verdict is computed. Every client renders what the backend says and none of them re-derive it, so if the ledger is wrong, every platform is wrong in the same way. I’d rather have the tests there than anywhere else.
The marketing site has zero tests. Also on purpose. Less defensible.
July was the rewrite, August is the grind
The shape of the work changed month to month, and the PR data shows it better than my memory does.
- June: 82 PRs merged, average 739 lines each, median 2 hours from open to merge.
- July: 202 PRs merged, average 982 lines, median 30 minutes.
- August, through the 22nd: 60 PRs merged, average 458 lines, median about an hour.
July touched 3,253 files and added 145,516 lines. The five biggest PRs in the project all landed between Jun 25 and Jul 19, and the largest, the full iOS cut for the minutes pivot, was 31,800 lines on its own. August touched 697 files. The average PR has halved since July, and most of the work is fixes from using the thing on my own phone.
I used to read a drop like that as losing steam. Turns out it is the product settling. The big decisions are made, so the changes are small, so the PRs are small.
Two things the totals hide
The report ends with a section I asked for on purpose: what a slice found that the totals cover up. Two things came back.
Android and the Chrome extension have been frozen since Aug 6. Both work. Android has 146 Kotlin files and 52 test files, and the extension blocks with declarativeNetRequest and has 18 test files. But Android merged all 13 of its lifetime PRs inside one two-day window in early July, and neither has merged feature work since. The iOS and macOS apps are what I use every day, so they are what moves. The other two are waiting.
ADR-0023 has drifted from the code. It names four OffMainKit modules, including one called RecheckKit. RecheckKit does not exist anywhere in the Apple repo. The real fourth module is FilterKit, which the ADR never mentions. The architecture doc in that repo is already correct, so nothing is broken. But the decision record is wrong and no later ADR fixes it. I owe it an amendment.
I wouldn’t have found either of those from the headline counts. That is why the prompt has that section.
What the trajectory looks like from here
Nine weeks in, I use the product every day on my own phone and Mac, and the PRs are getting smaller. Nothing is installable by anyone else yet, and I’m not going to pretend the beta is closer than it is.
But I have never stayed on a side project this long. The grid says I showed up 58 days out of 63. I plan to keep filling it in.
Real work buys real breaks. It has not bought a finished side project yet. Ask me at day 126.